
Here is how we build a Towbook to Power BI reporting pipeline that lands Towbook data in a warehouse, transforms it into dispatch and AR models, and refreshes a Power BI dataset on a schedule. The result is a single dashboard for owners covering active calls, driver performance, and aging by customer. This post is for towing operators and dispatch leaders who want live visibility without manual exports.
Towbook to Power BI automation is: a scheduled extract of Towbook data into a warehouse, modeled into fact and dimension tables, then published to a Power BI dataset that refreshes on a cadence for dispatch and AR visibility.
The problem it solves
A towing operation without a reporting pipeline depends on ad hoc exports and screenshots. Dispatch KPIs drift by the hour. AR aging requires hunting through invoices. Night managers do not see the same picture as days. The fix is wiring Towbook into a warehouse and scheduling Power BI refresh so everyone sees the same source of truth.
| Manual process | Automated with Towbook to Power BI |
|---|---|
| Export reports when someone asks, reformat in Excel, Slack a screenshot | Data lands on a schedule, Power BI refreshes automatically, links never go stale |
| No consistent AR view across customers or aging buckets | AR aging table computed once, reused across all visuals and filters |
| Driver performance debated anecdotally | Standardized dispatch facts: acceptance time, on scene, clear times, cancellations |
| End of day rolls up inconsistently across shifts | Scheduled refresh gives the same cut of the day for everyone |
How the automation works
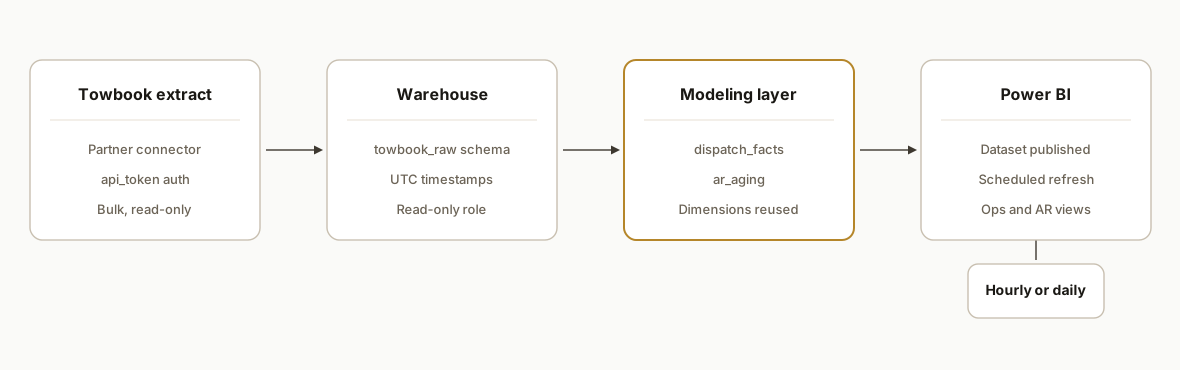
We use a partner connector to extract Towbook data into a cloud warehouse on a schedule, model it into dispatch facts and AR aging, and point Power BI at the modeled schema. Without assuming undocumented endpoints, we lean on an extract-only path and model for analysis rather than operational writes.
- Towbook extract via partner connector: Polytomic documents Towbook as a bulk sync source that requires an api_token. Public developer docs are not confirmed, so we treat the connector as the supported path and avoid guessing endpoints.
- Warehouse landing zone: The connector writes normalized Towbook tables into a schema in Postgres or a cloud warehouse. We preserve raw tables and build models in a separate analytics schema.
- Modeling layer: SQL views materialize dispatch_facts and ar_aging from raw tickets, customers, invoices, and payments. We compute durations and aging buckets centrally so Power BI stays thin.
- Power BI dataset and refresh: Power BI connects to the analytics schema. We publish the dataset and set scheduled refresh. For AR, QuickBooks can be added as a secondary feed if Towbook pushes invoices there.
Step-by-step: how to build it
1) Land Towbook data with a partner connector
Use a third-party connector that supports Towbook as a bulk sync source. Configure the connection, pick a destination schema, and schedule extract frequency. Public Towbook API docs are not confirmed, so we do not assume endpoint details.
Connector: Polytomic (Towbook source)
Auth: api_token (entered in connector UI)
Destination: Postgres (db: tow_ops, schema: towbook_raw)
Sync: Hourly (read-only bulk)
Tables selected: tickets, drivers, trucks, customers, invoices, payments (names vary by connector)
Key gotcha: treat the connector as read-only. Do not plan writes back to Towbook through this path.
2) Create an analytics schema and base views
Isolate modeling from raw by creating an analytics schema. Build base views that rename and type columns without inventing field names. Keep them thin and reversible.
-- Schema setup
CREATE SCHEMA IF NOT EXISTS analytics;

-- Example: customers base view
CREATE OR REPLACE VIEW analytics.customers AS
SELECT
  id::text            AS customer_id,
  name::text          AS customer_name,
  COALESCE(trim(email::text), '') AS email,
  COALESCE(trim(phone::text), '') AS phone,
  created_at::timestamp            AS created_at
FROM towbook_raw.customers;
Key gotcha: standardize timestamps to UTC in the warehouse and adjust timezone in Power BI visuals.
3) Build dispatch_facts for ops KPIs
Compute durations and normalized statuses once so every chart stays consistent. Column names below illustrate the pattern without assuming Towbook internals.
CREATE OR REPLACE VIEW analytics.dispatch_facts AS
WITH base AS (
  SELECT
    t.id::text                    AS ticket_id,
    t.customer_id::text           AS customer_id,
    t.driver_id::text             AS driver_id,
    t.truck_id::text              AS truck_id,
    t.status::text                AS raw_status,
    t.priority::text              AS priority,
    t.created_at::timestamp       AS created_ts,
    t.accepted_at::timestamp      AS accepted_ts,
    t.enroute_at::timestamp       AS enroute_ts,
    t.on_scene_at::timestamp      AS on_scene_ts,
    t.cleared_at::timestamp       AS cleared_ts,
    t.canceled_at::timestamp      AS canceled_ts
  FROM towbook_raw.tickets t
)
SELECT
  ticket_id,
  customer_id,
  driver_id,
  truck_id,
  CASE
    WHEN canceled_ts IS NOT NULL THEN 'Canceled'
    WHEN cleared_ts  IS NOT NULL THEN 'Cleared'
    ELSE 'Active'
  END AS status,
  priority,
  created_ts,
  accepted_ts,
  enroute_ts,
  on_scene_ts,
  cleared_ts,
  EXTRACT(EPOCH FROM (accepted_ts - created_ts)) / 60.0 AS minutes_to_accept,
  EXTRACT(EPOCH FROM (on_scene_ts - enroute_ts)) / 60.0 AS minutes_enroute,
  EXTRACT(EPOCH FROM (cleared_ts - on_scene_ts)) / 60.0 AS minutes_on_scene,
  EXTRACT(EPOCH FROM (cleared_ts - created_ts)) / 60.0 AS minutes_total
FROM base;
Key gotcha: incomplete tickets will have null timestamps. Use null-safe math or coalesce only in visuals, not in the model.
4) Build ar_aging across invoices and payments
If Towbook syncs invoices to QuickBooks for accounting, you can treat QuickBooks as the source of truth for AR. If you keep Towbook as the source, compute balances and aging in the warehouse and expose it to BI.
CREATE OR REPLACE VIEW analytics.ar_aging AS
WITH inv AS (
  SELECT
    i.id::text          AS invoice_id,
    i.customer_id::text AS customer_id,
    i.issue_date::date  AS issue_date,
    i.due_date::date    AS due_date,
    i.total_amount::numeric(12,2) AS amount
  FROM towbook_raw.invoices i
),
pmts AS (
  SELECT
    p.invoice_id::text  AS invoice_id,
    SUM(p.amount::numeric(12,2)) AS paid
  FROM towbook_raw.payments p
  GROUP BY 1
),
joined AS (
  SELECT
    inv.invoice_id,
    inv.customer_id,
    inv.issue_date,
    inv.due_date,
    inv.amount,
    COALESCE(pmts.paid, 0) AS paid,
    (inv.amount - COALESCE(pmts.paid, 0)) AS balance,
    CURRENT_DATE - inv.due_date AS days_past_due
  FROM inv
  LEFT JOIN pmts ON pmts.invoice_id = inv.invoice_id
)
SELECT
  j.invoice_id,
  j.customer_id,
  j.issue_date,
  j.due_date,
  j.amount,
  j.paid,
  j.balance,
  CASE
    WHEN j.balance <= 0 THEN 'Paid/Zero'
    WHEN j.days_past_due <= 0 THEN 'Current'
    WHEN j.days_past_due BETWEEN 1 AND 30 THEN '1-30'
    WHEN j.days_past_due BETWEEN 31 AND 60 THEN '31-60'
    WHEN j.days_past_due BETWEEN 61 AND 90 THEN '61-90'
    ELSE '90+'
  END AS aging_bucket
FROM joined j;
Key gotcha: decide where truth for AR lives. If it is QuickBooks, join that feed here. If it is Towbook, ensure payment imports are complete before computing aging.
5) Connect Power BI to the analytics schema
Use Power Query to connect to your warehouse and select analytics views. Keep visuals thin by reusing the modeled columns and measures.
let
  Source = PostgreSQL.Database("your-postgres-host", "tow_ops", [CreateNavigationProperties=false, CommandTimeout=#duration(0,0,10,0)]),
  Analytics = Source{[Schema="analytics"]}[Data],
  Dispatch = Analytics{[Name="dispatch_facts"]}[Data],
  ARAging  = Analytics{[Name="ar_aging"]}[Data]
in
  [Dispatch=Dispatch, ARAging=ARAging]
Key gotcha: set privacy levels and foldable transforms carefully. Push heavy transforms to SQL, not Power Query.
6) Publish the dataset and schedule refresh
Publish the report and dataset to Power BI Service. Set dataset credentials to the warehouse and configure scheduled refresh. If you need shorter lag, increase the connector sync cadence or consider DirectQuery where appropriate.
Power BI Service steps:
- Workspace: Operations
- Datasets: Tow Ops Analytics
- Data source credentials: Warehouse user with read-only role
- Scheduled refresh: Enabled, cadence aligned to connector sync
Key gotcha: align connector sync cadence with Power BI refresh windows so you do not refresh before new data lands.
7) Add DAX for standardized KPIs
Keep a small set of reusable measures in the dataset so every page uses the same math.
Active Tickets = COUNTROWS(FILTER(Dispatch, Dispatch[status] = "Active"))
Avg Minutes to Accept = AVERAGE(Dispatch[minutes_to_accept])
AR Total Balance = SUM(ARAging[balance])
AR 90+ = CALCULATE(SUM(ARAging[balance]), ARAging[aging_bucket] = "90+")
Key gotcha: persist bucket logic in SQL to avoid divergent definitions between teams.
Where it gets complicated
- No public Towbook API docs: We do not assume undocumented endpoints or webhooks. We use a partner connector that supports Towbook as a bulk extract and design for polling based refresh.
- Read-only bulk sync: Polytomic documents Towbook as a bulk sync source. That implies extract-only. Treat the warehouse as your read model, not a write-back path.
- Near real-time expectations: Without confirmed webhooks, near-real-time means faster polling or pairing with partner signals like GPS integrations that Towbook supports through vendor coordination. Expect coordination with Towbook or partners for those integrations.
- AR source of truth: If Towbook pushes invoices into QuickBooks, collections and GL usually live there. Our pattern is to model Towbook AR first, then join QuickBooks when finance needs a final tie-out.
- Time zones and shifts: Timestamps in raw extracts are often UTC. Dispatch cares about local time. We standardize to UTC in SQL, then surface local time in visuals for each yard or zone.
- Row-level security: If you share dashboards with yard managers or contract partners, add RLS by customer, location, or manager group in Power BI. Keep the filters aligned with your modeled dimensions.
What this actually changes
What this changes for a mid-size towing company is that manual exports and the debate about the numbers go away. Dispatch gets a live board for acceptance and on scene times. Collections gets an aging page filtered by customer with the same buckets finance uses. Owners see active calls, clear rates, and 90 plus in one place. The value is structural: one dataset, one schedule, one definition of each KPI.
One external benchmark worth noting: companies that are highly data driven are nearly three times more likely to report significant improvements in decision making, according to PwC's Global Data and Analytics Survey 2016. Source: https://www.pwc.com/us/en/services/consulting/analytics/big-decisions-survey.html
Frequently asked questions
Does Towbook have a public API I can use directly?
Public developer docs were not confirmed. We avoid assumptions and use a partner connector that supports Towbook as a bulk sync source. If you want direct API details, confirm availability with Towbook support before planning around it.
Can I use Zapier or Make to get Towbook data into Power BI?
An official Towbook app in Zapier or Make was not confirmed. For reporting, a warehouse extract via a partner connector is the reliable path. If Towbook confirms native integrations later, you can revisit those for light workflows.
How close to real time can the dashboard be?
Without confirmed webhooks, treat it as scheduled near-real-time. Increase the connector sync cadence and align the Power BI refresh. For minute-level views, coordinate partner signals such as GPS integrations that Towbook supports through vendor steps.
Where should AR truth live: Towbook or QuickBooks?
If Towbook pushes invoices to QuickBooks and finance reconciles there, use QuickBooks as AR truth and join it in the warehouse. If Towbook remains the operational source, ensure payments are complete before computing aging.
What does this cost monthly?
The connector and warehouse are the primary costs, plus Power BI licensing. Build cost is one-time. Ongoing cost scales with data volume and refresh cadence. We design this to minimize Power BI transformations so the warehouse does the heavy work.
This is the pattern we build: Towbook extract via a partner connector, dispatch and AR modeled in SQL, and a scheduled Power BI refresh that keeps ops and collections aligned. If you want that outcome, see our service details under Custom AI Integration, read our related Towbook guide Towbook API Integration: Dispatch Dashboard, and book a 20-minute call.
Sources
- 1.Big decisions surveypwc.com
Want us to build this for you?
Nine questions, about 90 seconds. You see the revenue it is costing you, then pick a time. No pitch.
See your options