
Dispatch dashboard automation is the system that continuously pulls loads and statuses from your TMS, enriches them with load board events and live ELD or GPS positions, and renders a single live screen of exceptions and KPIs for brokers and dispatchers. We built and shipped this pattern so a brokerage could manage the day in one place instead of five tabs.
If you run a freight brokerage or a small carrier with a brokerage arm, this guide shows how the pipeline works, how we built it, and where the tricky parts live when your TMS or telematics stack is inconsistent.
The problem it solves
You can run dispatch on spreadsheets, phone calls, and a TMS tab. It works until volume climbs. Then the team is copying pro numbers into a sheet, calling drivers for location, checking three portals for status, and missing updates because no system is the single source of truth.
| Work item | Manual flow | Automated flow |
|---|---|---|
| Load status updates | Dispatcher copies status from TMS and load board into a sheet every hour | Event watcher ingests changes and writes to a live state store in seconds |
| Driver location | Phone calls and texts to drivers for ETA and position | ELD or GPS pings merge into the load row with stale-time warnings |
| Exception detection | Visual scan of many rows to notice late pickups or no-tracking | Rules engine raises exceptions: late risk, stale GPS, missing docs |
| Customer view | Ad hoc screenshots or emails | Read-only dashboard link with filters and masked identifiers |
| Morning standup | 20 minutes to assemble KPIs | KPIs render live from the same state store |
A live dashboard replaced check calls and tab hopping with one surface that shows what changed and what needs attention now. That was the outcome we shipped.
How the automation works
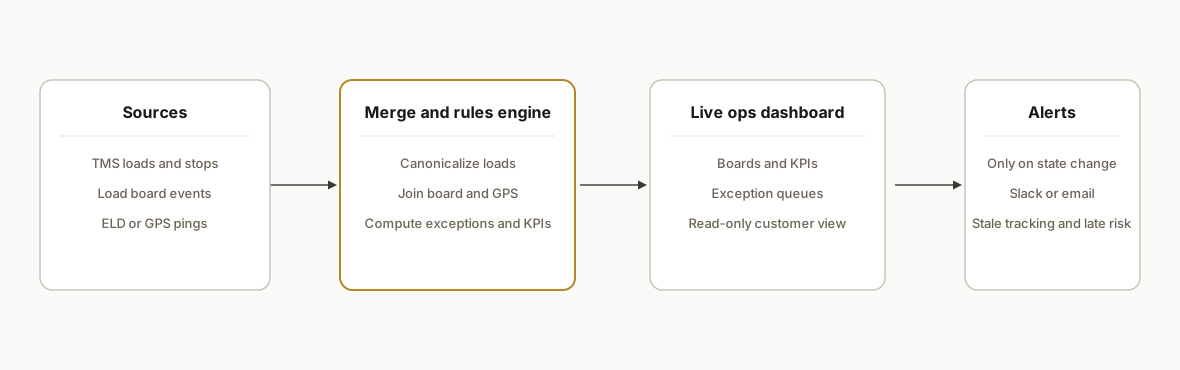
At a high level: we normalize three streams: TMS loads, load board events, and ELD or GPS pings. We merge them into a single canonical record per load in a managed Postgres database. A small rules layer computes exceptions and KPIs. A Next.js dashboard reads the same state in real time and a notifier posts only the changes that matter to Slack or email.
- TMS adapter: Pulls loads and stops on a schedule. When the TMS has no usable API, we consume scheduled CSV exports or emailed reports and map them into the canonical shape. We key by a stable load identifier and use idempotent upserts.
- Load board watcher: Ingests board-side events that brokers care about: post, match, covered, fall-off. Where no webhook exists, we rely on email parsers or periodic exports the platform already provides.
- ELD or GPS connector: Merges tractor or driver pings into the active load using a join key you actually own in both systems. We compute stale-age and off-route hints rather than logging every ping.
- State store and rules: A single Postgres schema holds canonical tables for loads, stops, assets, and events. A rules job computes status, ETA deltas, and exception flags.
- Dashboard and alerts: A Vercel-hosted dashboard renders KPIs, boards and exception queues. A notifier publishes only when a record changes state or crosses a threshold.
Step-by-step: how to build it
1) Define the canonical load shape and keys
Decide what one row of truth looks like. Include fields you can derive everywhere: load_id, ref numbers, pickup and delivery windows, status, asset_id, driver handle, last_gps_at, last_gps_coords, covered_at, and exception flags. Then declare uniqueness.
-- Canonical loads table with idempotent upserts in mind
create table if not exists loads (
  load_id text primary key,
  ref_number text,
  customer_name text,
  pickup_apt timestamptz,
  delivery_apt timestamptz,
  status text,
  asset_id text,
  driver_code text,
  last_gps_at timestamptz,
  last_gps_lat double precision,
  last_gps_lng double precision,
  covered_at timestamptz,
  exceptions jsonb default '{}'::jsonb,
  updated_at timestamptz not null default now()
);

create index if not exists idx_loads_status on loads(status);
Key gotcha: pick a load_id you can reproduce from every source. If your TMS uses a numeric ID and your load board does not carry it through, add a ref mapping table and keep it current.
2) Ingest the TMS on a schedule without breaking users
When there is no webhook, add a scheduler that fetches the TMS export or watches an intake mailbox for CSV attachments, then upserts rows.
// Simplified Node handler: parse CSV export and upsert rows
import { parse } from "csv-parse/sync";
import pg from "pg";

const pool = new pg.Pool({ connectionString: process.env.DATABASE_URL });

export async function ingestTmsCsv(csvBuffer) {
  const rows = parse(csvBuffer, { columns: true, skip_empty_lines: true });
  const client = await pool.connect();
  try {
    await client.query("begin");
    for (const r of rows) {
      await client.query(
        `insert into loads (load_id, ref_number, customer_name, pickup_apt, delivery_apt, status)
         values ($1,$2,$3,$4,$5,$6)
         on conflict (load_id) do update set
           ref_number=excluded.ref_number,
           customer_name=excluded.customer_name,
           pickup_apt=excluded.pickup_apt,
           delivery_apt=excluded.delivery_apt,
           status=excluded.status,
           updated_at=now()`,
        [r.LoadID, r.RefNumber, r.Customer, new Date(r.PickupAppt), new Date(r.DeliveryAppt), r.Status]
      );
    }
    await client.query("commit");
  } catch (e) {
    await client.query("rollback");
    throw e;
  } finally {
    client.release();
  }
}
Key gotcha: treat the mailbox or export location as unreliable. Expect duplicates and partial files. Idempotent upserts and a minimum row validator save hours later.
3) Normalize load board events into the same state
Many boards can send you a copyable status artifact by email or export. Parse the event, map it to a known load_id, then write it into a lightweight events table and also update the load row.
create table if not exists load_events (
  id bigserial primary key,
  load_id text not null references loads(load_id),
  source text not null,
  event_type text not null,
  event_at timestamptz not null,
  payload jsonb not null
);

-- Example: mark covered
update loads
  set status = 'COVERED', covered_at = now(), updated_at = now()
where load_id = $1;
Key gotcha: never hard-fail an event because the mapping is unknown. Write the event as unlinked with a null load_id and queue it for a human to resolve in the dashboard. This prevents silent loss.
4) Merge ELD or GPS pings without flooding the DB
ELD or GPS providers push frequent pings. You do not need every point. Downsample by time or distance and only write changes that move the ETA or stale clock.
// Upsert a ping only if it changes the derived state
async function applyPing({ assetId, lat, lng, pingAt }) {
  const { rows } = await pool.query(
    `select load_id, last_gps_at, last_gps_lat, last_gps_lng from loads where asset_id=$1 and status in ('ASSIGNED','DISPATCHED') limit 1`,
    [assetId]
  );
  if (!rows.length) return;
  const l = rows[0];
  const tooSoon = l.last_gps_at && new Date(pingAt) - new Date(l.last_gps_at) < 120000; // 2 minutes
  const sameCell = Math.abs(lat - l.last_gps_lat) < 0.0005 && Math.abs(lng - l.last_gps_lng) < 0.0005;
  if (tooSoon && sameCell) return; // skip noisy ping
  await pool.query(
    `update loads set last_gps_at=$1, last_gps_lat=$2, last_gps_lng=$3, updated_at=now() where load_id=$4`,
    [pingAt, lat, lng, l.load_id]
  );
}
Key gotcha: GPS staleness is often more actionable than the last point. Compute a stale threshold per lane and flag it in exceptions.
5) Compute exceptions and KPIs on a cadence
Keep rules in code so you can evolve them. Typical exceptions: no tracking for N minutes while en route, late risk against pickup window, missing documents after delivery, fall-off risk if uncovered too close to pickup.
-- Flag loads with stale tracking while en route
update loads
set exceptions = jsonb_set(coalesce(exceptions, '{}'::jsonb), '{stale_tracking}', 'true', true)
where status in ('ASSIGNED','DISPATCHED')
  and (now() - coalesce(last_gps_at, to_timestamp(0))) > interval '20 minutes';

-- Simple KPI example: covered ratio today
select date_trunc('day', updated_at) as day,
       count(*) filter (where status='COVERED')::float / nullif(count(*),0) as covered_ratio
from loads
where updated_at >= now() - interval '7 days'
group by 1
order by 1 desc;
Key gotcha: compute KPIs from the same tables you render on the screen. Do not build a separate analytics store unless volume forces you.
6) Render the dashboard and publish only deltas
We ship the dashboard as a server-rendered web app so it stays fast on poor office connections. The notifier compares the previous snapshot to the new one and only posts changes.
// Minimal change-publisher sketch
function diffAndPublish(prev, next) {
  for (const id of Object.keys(next)) {
    const a = prev[id];
    const b = next[id];
    if (!a || a.status !== b.status || a.exceptions !== b.exceptions) {
      postToSlack(formatMessage(b));
    }
  }
}
Key gotcha: dispatch channels burn out when every change is a notification. Publish only when state changes materially.
Where it gets complicated
No TMS API or webhooks. We bridged this with scheduled exports and mailbox ingestion. The engineering work is in dedupe keys, partial-file detection, and a clean retry strategy so an interrupted export does not poison the state.
Mismatched identifiers across systems. Load IDs and reference numbers rarely match across TMS, board, and GPS. We keep a small mapping table and a human queue. Unmapped events never 404. They land in a triage bin so a broker can link them once and move on.
Time zones and windows. Pickup windows and ETA deltas cross zones all day. We standardize to UTC in the store and only localize at the edge in the UI to avoid late false positives.
ELD or GPS ping shapes vary. Some providers push per-asset. Others let you poll a fleet endpoint. We implement a provider adapter so the merge layer sees one shape and one contract, regardless of the vendor.
Backfills and replays. First-day backfills can flood the notifier and clobber KPIs. We run backfills with notifications disabled and mark historical rows with a different updated_at path to keep charts clean.
Security and privacy. Driver location is sensitive. We hide exact coordinates on any read-only customer view and show a coarse cell with a last-updated clock. Access is role-based and audit-logged.
What this actually changes
In production the dispatch manager saw the day on one screen: which loads were at risk, which drivers had stale tracking, and which uncovered posts were too close to pickup to ignore. Check calls dropped because the stale tracker told the team where to look first. The value was structural: same broker headcount, fewer misses, and faster exception handling because everything updated off one state store.
As context, congestion alone can erase hours of plan time. The American Transportation Research Institute estimated traffic congestion cost the trucking industry $94.6 billion in 2021 (source: ATRI Cost of Congestion report). A live view does not remove congestion. It lets you react to it faster.
Frequently asked questions
Does this work if my TMS has no API?
Yes. We design an adapter that consumes scheduled CSV exports or emailed reports and maps them into a canonical record. The pipeline is idempotent, so reprocessing an export will not duplicate loads. When an API becomes available, we swap the adapter without changing the dashboard.
Can it update in real time?
Close to it. TMS exports usually land every 5 to 15 minutes. ELD or GPS pings arrive in minutes. We publish only when state changes. If your TMS exposes event notifications, we wire those in and shorten the gap further.
How do you prevent duplicate loads and noisy alerts?
We key every write to a stable load_id and use database upserts. The notifier compares previous and current snapshots and only posts on material changes like status transitions or a new exception flag. Backfills run with notifications disabled to avoid alert storms.
What if my load board will not let me automate against it?
We respect each platform's allowed export surfaces. Where direct event hooks are not provided, we rely on the artifacts the platform already sends you like summary emails or downloadable reports rather than scripting against a prohibited surface.
What does this cost monthly to run?
The software footprint is light: a managed Postgres instance, a serverless dashboard, and a small job runner. The primary cost is the build. Ongoing cloud costs are typically modest for a brokerage-scale volume. We quote the build after scoping your TMS and telematics vendors.
Can my customers see their loads?
Yes with guardrails. We publish an optional read-only view that shows masked identifiers, coarse location cells, and last-updated clocks rather than exact GPS. Access is scoped per customer.
If you are running dispatch from a TMS tab, a GPS portal, and a spreadsheet, this pattern is the way out. We have built and shipped it with adapters when platforms had no clean hooks. If you want the same surface for your brokerage, read our related post on Tailwind TMS to accounting automation and see our custom AI integration services. When you are ready, book a 15 minute call. We will scope your adapters in the first conversation.
Want us to build this for you?
Nine questions, about 90 seconds. You see the hours it is costing you, then pick a time. No pitch.
Get your free assessment